
- June 2026 (2)
- May 2026 (2)
- April 2026 (2)
- March 2026 (3)
- February 2026 (2)
- January 2026 (2)
- December 2025 (2)
- November 2025 (2)
- October 2025 (3)
- September 2025 (3)
- August 2025 (3)
- July 2025 (2)
- June 2025 (3)
- May 2025 (3)
- April 2025 (3)
- March 2025 (2)
- February 2025 (1)
- December 2024 (2)
- November 2024 (1)
- August 2024 (2)
- June 2024 (3)
- May 2024 (3)
- April 2024 (1)
- March 2024 (3)
- February 2024 (2)
- January 2024 (2)
- December 2023 (1)
- November 2023 (2)
- October 2023 (2)
- September 2023 (1)
- August 2023 (1)
- July 2023 (2)
- June 2023 (3)
- May 2023 (1)
- March 2023 (4)
- January 2023 (2)
- November 2022 (2)
- September 2022 (1)
- August 2022 (2)
- July 2022 (2)
- June 2022 (1)
- May 2022 (1)
- April 2022 (3)
- March 2022 (1)
- February 2022 (3)
- January 2022 (2)
- December 2021 (1)
- November 2021 (1)
- October 2021 (2)
- September 2021 (3)
- August 2021 (1)
- July 2021 (3)
- May 2021 (2)
- April 2021 (2)
- March 2021 (2)
- February 2021 (3)
- January 2021 (3)
- December 2020 (1)
- October 2020 (1)
- August 2020 (1)
- August 2019 (1)
- January 2019 (2)
- September 2018 (5)
- June 2018 (1)
- November 2017 (1)
- September 2017 (1)
- July 2017 (1)
- May 2017 (1)
- January 2017 (1)
- October 2016 (2)
- August 2016 (1)
- July 2016 (1)
- June 2016 (1)
Subscribe by email
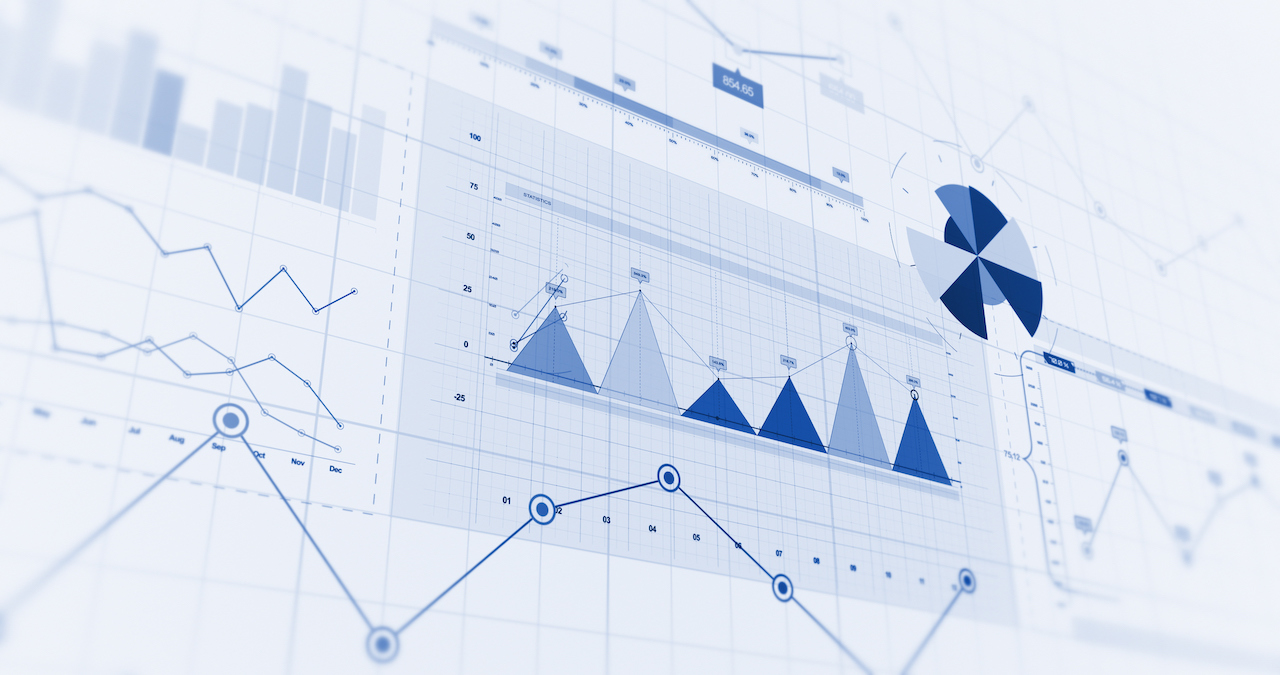
The data generated by connected devices is only as valuable as the insight it delivers and the outcomes it drives. Analytics is no longer a nice-to-have for organizations building and scaling IoT-enabled products. It’s essential for turning operational visibility into business strategy.
This goes beyond monitoring device health or tracking uptime. It’s about surfacing the trends that shape customer behavior, knowing where value is being created or lost, and making informed decisions around pricing, packaging, and growth to drive sustainable revenue.
While IoT analytics can span everything from raw sensor data to AI-powered automation, the most direct impact on revenue often comes from a narrower slice: visibility into connectivity, billing, and subscription performance. Zipit’s connectivity and billing management platform for IoT devices delivers these insights, giving OEMs and service providers the data they need to run more profitable, scalable businesses.
In this article, we’ll take a broad look at the evolving role of IoT data and then focus on how visibility into usage and monetization can drive measurable growth.
Key Takeaways:
-
IoT analytics is essential for turning raw device data into strategic business decisions and revenue growth.
-
Structured data on connectivity, usage, and billing delivers the most actionable insights for monetization.
-
Four key analytics types—descriptive, diagnostic, predictive, and prescriptive—enable deeper operational and financial insight.
-
Visualization and accessibility are critical for making insights usable across teams and driving action.
-
Zipit’s platform helps OEMs and service providers optimize pricing, reduce churn, and scale recurring revenue models.
What Is IoT Data Analytics?
At its core, IoT data analytics is about turning raw device data into something useful. Devices constantly send information, like usage rates, environmental conditions, cellular consumption, or status. Analytics allows businesses to make sense of that flow of information and apply it meaningfully.
Big IoT data refers to high-volume, high-velocity, and high-variety datasets, often collected from sensors, cameras, or industrial equipment. This data tends to be unstructured or semi-structured and requires specialized infrastructure and processing tools to extract value. Examples include temperature readings sampled multiple times per second, continuous machine logs, or large video files.
Structured IoT data, on the other hand, is cleaner, more focused, and often directly tied to business operations. It can include data, like device activation status, SIM usage, plan enrollment, and billing history. While not massive in scale, it’s highly actionable and ideal for powering dashboards, triggering alerts, or guiding monetization strategies.
There are four main approaches to analyzing IoT data:
- Descriptive analytics establishes what has already occurred. It helps quantify trends and set performance baselines, such as how many devices were active last month, total data consumption, or revenue shifts by region or product line.
- Diagnostic analytics explains why something happened. When usage spikes unexpectedly or a group of devices goes offline, diagnostic tools help pinpoint the root cause—a network coverage issue, an expired subscription, or a device configuration error.
- Predictive analytics anticipates what’s likely to happen. It can forecast trends like future data consumption or customer churn by modeling historical data and usage patterns. These insights are especially valuable for planning capacity, refining pricing strategies, and identifying at-risk accounts early.
- Prescriptive analytics goes a step further, recommending specific actions to improve outcomes. It’s where analytics becomes strategy, guiding decisions such as which plan tiers to optimize, how to adjust pricing models, or when to trigger automated workflows based on real-time behavior.
Zipit’s platform supports these analytics approaches within connectivity and monetization. It surfaces cellular usage analytics to help teams establish performance baselines and identify device consumption trends (descriptive). It provides activation and deactivation insights to uncover the root causes behind subscriber churn (diagnostic). It supports forecasting tools to anticipate usage spikes, churn, or plan-level performance based on historical patterns (predictive). It also delivers subscription, revenue, and margin analytics that inform pricing models, tier adjustments, and upsell strategies (prescriptive).
All of this is made actionable through real-time dashboards and APIs that enable OEMs and service providers to make confident, data-driven decisions supporting growth.
How IoT data analytics works
The analytics process looks different depending on your use case or industry, but most workflows follow the same path from data collection to decision-making.
1. Data collection
The process starts at the edge. Devices capture information through sensors, logs, or network activity, generating constant streams of data. Depending on the application, this might include environmental readings, location tracking, SIM activity, or cellular data consumption.
The critical factor here isn’t just volume, but accuracy. Unreliable input undermines every layer that follows. Without consistent, trustworthy data at the source, even the most advanced analytics pipelines yield misleading results.
2. Storage
As connected devices generate high volumes of data in varied formats and from distributed sources, organizations face the challenge of storing it efficiently, affordably, and in a way that supports timely analysis.
Cloud-based storage provides scalability, centralization, and cost-effective options for handling data from thousands or even millions of devices. Cloud platforms make it possible to ingest and organize data in near real time.
For big data, organizations often implement distributed, fault-tolerant storage systems that support parallel processing and complex querying. These can be built on top of cloud infrastructure using tools like Apache Hadoop, Spark, or cloud-native data lakes and warehouses.
3. Analytics
Once data is centralized and organized, it can be analyzed for meaning. Algorithms, which could include simple queries or machine learning models, surface patterns, identify anomalies, and draw connections across datasets.
In many cases, analytics runs continuously in the background. It can flag abnormalities, track trends, or trigger automated responses when specific thresholds are reached. In other cases, analytics is event-driven, tied to billing cycles, device activation windows, or customer behavior signals. Regardless of the model, the objective remains the same: convert raw data into operational or strategic insight.
4. Visualization
Data only becomes useful when it’s understood. Charts, dashboards, alerts, and reports translate complex metrics into something a business leader or operations manager can actually act on. Whether you’re viewing aggregated usage trends across thousands of devices or zooming in on one device’s data plan consumption, clear visualization tools make all the difference. Without them, it’s easy to miss what matters or spend too much time chasing down details that don’t.
How IoT analytics transforms businesses
Analytics isn't just a reporting function—it’s a strategic asset. When applied thoughtfully, IoT data analytics can create tangible business outcomes across a wide range of use cases. Whether you’re a manufacturer, service provider, or technology company, the ability to extract meaning from connected device data can be a competitive advantage.
New revenue streams
Data can reveal entirely new ways to package and sell value. Instead of treating connected devices as one-time hardware sales, many companies have shifted to recurring revenue models based on usage, performance, or access. Analytics helps identify where that shift is feasible and what customers are willing to pay for. It also allows you to monitor performance and billing in real time, which is essential for managing subscriptions at scale.
For example, if you know which devices are used heavily and which sit idle, you can introduce tiered pricing. If your platform detects that customers are routinely exceeding their current data plan, that’s an opportunity for upselling. This kind of intelligence turns raw usage into business strategy.
Cost reduction
Analytics helps you understand where resources are going and where they’re being wasted. It might show you that certain devices are consuming more data than expected, or that some SKUs experience a high rate of deactivation shortly after onboarding. These insights can point to problems in design, configuration, support, or customer onboarding. Visibility into these trends lets you make operational changes that reduce churn, improve support, and cut avoidable costs.
Well-informed business decisions
The right data, at the right time, supports smarter decisions across product, sales, marketing, and support. Should you launch in a new market? Should you adjust your connectivity plans to better match customer behavior? Should you invest in developing a new device feature or retire one that’s underused? IoT analytics provides clarity. And when that clarity is tied directly to how your devices are used and monetized, the impact reaches across the entire organization.
Better customer experiences
Analytics also helps you deliver more personalized and responsive service. You can proactively alert customers when they’re approaching their data limits, automate renewals based on usage, or flag unusual behavior before it becomes a support issue.
When you understand what’s actually happening at the device level, you can anticipate pain points and offer solutions that feel intuitive rather than reactive. That builds trust and long-term customer loyalty.
Learn more: IoT Technology in Retail: From Inventory Management to Customer Experience
The value of connectivity from IoT devices and how to monetize it
Not all IoT data holds the same strategic value. In many deployments, sensors generate large volumes of raw data that must be cleaned, stored, and interpreted at scale. These big data workloads often require complex infrastructure and advanced analytics capabilities.
Truly useful data meets three criteria:
- Accurate–reflects reality and can be trusted
- Actionable–enables clear, timely decisions
- Relevant–aligns with business priorities
Structured data on connectivity, usage, and billing offers direct visibility into how connected products perform, as part of both a technical deployment and a monetized service model. Zipit’s platform is purpose-built to deliver this level of insight, giving OEMs and service providers a clear view into the operational and financial performance of their device fleets.
These aren’t abstract metrics; they’re business-critical indicators, including:
- Which devices are active, dormant, or deactivated
- How much cellular data each device consumes
- How customers engage with their subscription plans
- Which subscriptions are growing and which are underperforming
- Where margins are holding and where they’re eroding
This data delivers high business impact. With accurate, structured connectivity insights, you can optimize pricing, reduce churn, and scale with greater control.
Monetizing connectivity
This visibility isn’t just operational—it’s monetizable. Cellular usage is often viewed as a fixed cost, but with the right business model, it becomes a foundation for recurring revenue. Usage-based pricing, subscription tiers, and value-added services all rely on a clear understanding of how devices behave in the field and how customers interact with your offerings.
Zipit’s platform enables this by helping customers define flexible data plans, tailor subscriptions to usage patterns, and track revenue at the device or account level. That level of control supports more competitive pricing, smarter upselling, and expansion into new markets, without added operational complexity.
Challenges in IoT data analytics
Even with the right strategy in place, turning IoT data into meaningful business outcomes isn’t without obstacles. From system architecture to ethical considerations, organizations face a range of technical, operational, and organizational challenges along the way.
Below are the most persistent challenges companies must address to extract real value from their IoT analytics.
1. Managing device and data fragmentation
Devices are built by different manufacturers, run different firmware, use different communication protocols, and output different types of data. Even within a single deployment, you might have multiple device generations reporting back in slightly different ways.
For big data environments, such as smart cities, industrial automation, or complex sensor networks, this diversity leads to serious compatibility issues. Data normalization becomes its own engineering effort, and even small inconsistencies can ripple through your analytics.
For business-focused platforms like Zipit’s, the heterogeneity problem is narrower but still meaningful. For example:
- Different carriers may report usage or activation status differently.
- Devices in different countries may follow different billing structures or local compliance rules.
- SIMs may need to be managed across multiple MNOs, each with its own APIs and data schemas.
Solving this challenge requires strong backend integration, API standardization, and the ability to abstract complexity away from the end user, so the analytics feel unified, even when the infrastructure isn’t.
2. Ensuring clean, reliable input for analysis
Raw data is rarely ready for use. Extracting value begins with preparing it by resolving inconsistencies, handling nulls, filtering out duplicates, aligning timestamps, and identifying errors or outliers.
In high-volume datasets, especially from physical sensors, data can be dirty or incomplete for any number of reasons: device malfunction, transmission interruptions, miscalibrated sensors, or software bugs.
Even in smaller, structured datasets, like billing logs or device usage reports, issues can creep in:
- SIMs may show partial data due to temporary disconnects.
- Billing records might reflect edge cases not accounted for in pricing logic.
- Time-based events may be skewed by latency or cross-timezone processing.
If the analytics output is based on unreliable input, decisions will be misinformed.
3. Scaling infrastructure to support bandwidth and storage demands
Moving data from the edge to the cloud isn’t always simple, especially when devices are deployed globally, rely on cellular networks, or transmit frequently. The more devices you connect and the more often they report, the more pressure you put on your available bandwidth.
For high-resolution sensor data or continuous video feeds, bandwidth costs and bottlenecks can become unsustainable, forcing companies to choose between fidelity and affordability. Storage becomes another constraint: Do you keep everything? For how long? Where? And at what cost?
Even when the data footprint is lighter, those questions still matter. Consider:
-
What happens if a device can’t report usage for several hours due to a connectivity drop?
-
How should historical billing data be retained and accessed for audits or financial forecasting?
-
How can you support scalable analytics without slowing down access to live insights?
These challenges are why some companies adopt edge computing strategies. Others rely on tiered storage, keeping recent data accessible while archiving older datasets. For analytics to remain effective, the supporting infrastructure must keep pace. Without reliable transport and smart retention policies, the most valuable data can be delayed, distorted, or lost.
4. Making insights accessible and actionable
Analytics are only as useful as your ability to act on them, and that hinges on how well the data is presented. The raw data may be accurate and the analysis sound, but if the insights are buried in spreadsheets or scattered across exports, they can’t help your business move faster or smarter.
Effective visualization bridges the gap between data and decision. It transforms metrics into stories:
- Are we growing revenue per device this quarter?
- Are churn rates creeping up in a certain region?
- Did that change to our data plans improve margins?
Without intuitive, role-specific dashboards, these questions are hard to answer, especially for non-technical users. And that’s a problem. Because the people who need this information the most (product managers, operations leads, finance teams) shouldn’t need to write SQL queries to get answers.
That’s why visualization is an operational enabler, not just an aesthetic layer. A good dashboard:
- Surfaces the most important KPIs immediately
- Provides historical context and trendlines
- Flags outliers or anomalies in real time
- Makes it easy to drill down by product, region, or customer group
- Aligns with how teams actually think about their business
Zipit’s CMP is built around these principles. It shows how devices are used, what they cost, how they’re performing, and how they’re generating revenue.
For example:
- Subscription dashboards show monthly recurring revenue, average revenue per device, and subscription growth trends
- Usage views let teams monitor cellular consumption in real time and compare usage across data plans
- Margin and cost reporting help identify underperforming pricing models or high-cost regions
- Churn tracking gives insight into where and why deactivations are occurring
You can use these insights to refine product strategy, adjust pricing tiers, or identify new sales opportunities.
Zipit makes this data accessible without requiring a data analyst on staff. The platform does the heavy lifting by normalizing the data, calculating the KPIs, and presenting them in a way that's easy to interpret across teams.
Learn more: Mobile IoT Connectivity Explained: Challenges and Solutions for Global Deployments
The future of IoT analytics
As technology continues to evolve, the way businesses collect, process, and act on data is changing rapidly. The future of IoT includes faster insights, smarter automation, and broader accessibility across teams.
Here are a few key developments shaping what’s next:
1. AI and machine learning are moving into products
While predictive analytics and machine learning have been discussed for years, more organizations are now integrating them into everyday operations. From anomaly detection to usage forecasting, AI is helping teams go beyond what happened and understand what’s likely to happen next. In large-scale IoT deployments, this means spotting early warning signs of device failure, flagging fraudulent behavior, or identifying customers at risk of churn before it happens. Machine learning has the potential to refine pricing recommendations, suggest plan adjustments based on behavior, or improve demand planning by analyzing activation patterns over time.
2. Edge computing for faster, leaner insights
As data volumes grow and real-time responsiveness becomes more critical, many companies are turning to edge computing, processing data closer to where it’s generated, instead of relying solely on centralized cloud servers.
This trend is being driven by speed and cost-efficiency. In use cases where milliseconds matter, edge processing reduces latency. In other cases, it’s simply more efficient to summarize and transmit only the most important insights, rather than streaming raw data around the clock.
3. Greater emphasis on real-time, self-serve analytics
As businesses depend more on analytics to guide everyday decisions, there’s growing demand for real-time, self-serve access to insights, without relying on analysts or developers. In practice, this means analytics platforms need to be faster, more intuitive, and customizable by the user. When product teams, finance leads, and customer success managers can all access the same up-to-date data, decision cycles get shorter and alignment gets easier.
4. Monetization analytics becomes a core use case
As IoT business models evolve beyond device sales into subscriptions, usage-based billing, and bundled services, monetization data is central. Analytics tools must support more than operational oversight. They need to help companies understand how to optimize for profitability: which pricing models are working, which customers are most valuable, and where margin is being lost. As more OEMs adopt recurring revenue models, the ability to track and improve business performance in real time becomes essential, not optional.
Zipit's platform enables scalable, data-informed growth
Zipit’s connectivity management and billing platform is built for the business side of IoT, where usage, billing, and monetization metrics determine whether a product is simply functional or financially sustainable. Zipit focuses on the insights that drive operational clarity, revenue growth, and scale.
Business-critical connectivity and billing analytics
Zipit’s platform surfaces key metrics like:
- Device and SIM status: Which devices are active, inactive, or experiencing connectivity issues
- Cellular usage trends: Consumption by device, plan, region, or customer segment
- Billing and subscription performance: Plan enrollment, upgrade/downgrade activity, and recurring revenue patterns
- Revenue and margin visibility: Cost-to-serve vs. revenue-per-device insights for profitability analysis
- Churn indicators: Where deactivations are happening and what patterns suggest at-risk accounts
These analytics are available through intuitive dashboards and APIs, giving product managers, operations leads, and finance teams a shared source of truth.
Built for scale and actionability
Whether you’re managing hundreds of devices or scaling into new global markets, Zipit’s platform is designed to grow with you. Real-time visibility into usage and billing means you never operate in the dark. Subscription metrics give you early signals about product-market fit, pricing effectiveness, and customer engagement. And by tying this data directly into your monetization strategy, you can iterate faster and scale more confidently.
As IoT businesses evolve toward recurring revenue models, visibility into the business mechanics becomes a requirement, not a nice-to-have. Zipit helps you move beyond operational monitoring and into proactive, data-informed growth.
Contact our team of experts who can help you turn connectivity insights into a revenue strategy.
You may also like:
Related Content
The latest IoT insights and platform updates from Zipit.
For OEMs deploying and managing connected devices at scale, strong, reliable conne...

Choosing the wrong SIM for an IoT deployment can cost OEMs time, money, and long-t...

For years, international IoT deployments operated on the simple assumption that pe...
